Why New Zealand’s Deadliest Roads Are the Quiet Ones
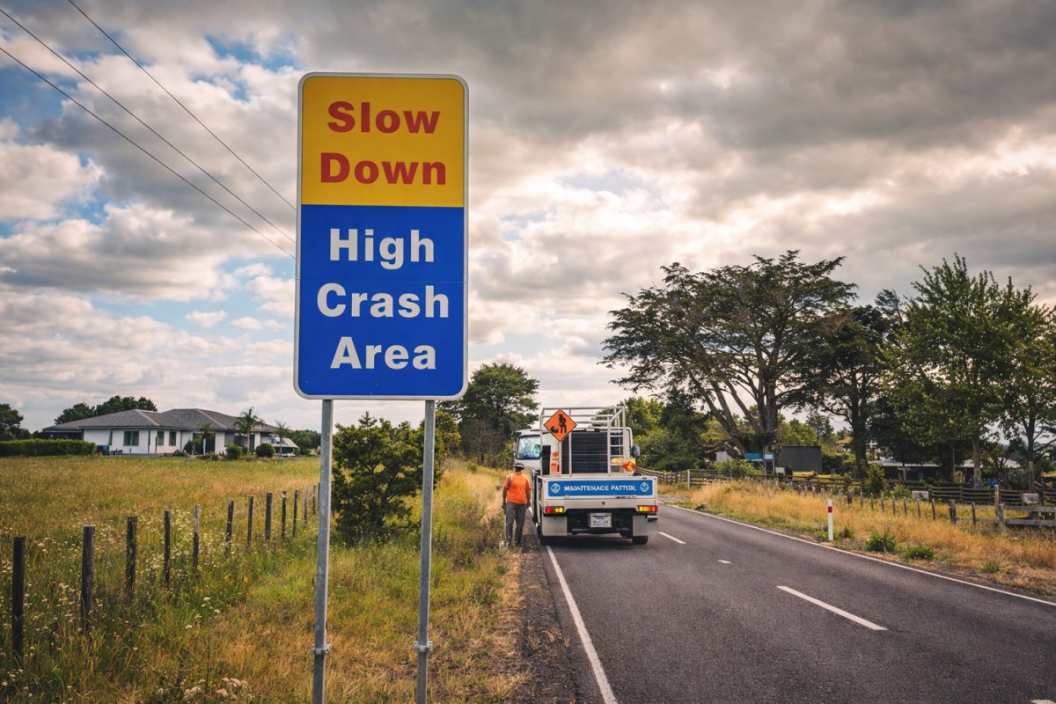
Drive an hour of the Napier-Taupo road on a wet Tuesday and you will pass more places where somebody has died than you will find on Auckland’s southern motorway. The rural network carries a minority of the country’s travel and a majority of its deaths, and it is not because country roads attract worse drivers. It is that the speed environment, the geometry and the power pole three metres from the seal have been left to do arithmetic no human body wins.
The Toll Sits Where the Traffic Is Not
Three Quarters of the Deaths, Under Half the Travel
Open the crash statistics the Ministry of Transport publishes and the split shows up immediately. Roads outside urban limits carry well under half of New Zealand’s vehicle kilometres travelled and account for roughly three quarters of the deaths. The imbalance holds year after year, which is the first clue that it is structural rather than circumstantial.
Urban crashes are more numerous and, overwhelmingly, survivable: a nose-to-tail at a 50 km/h intersection fills an emergency department, not a coroner’s list. The rural crash is rarer per kilometre driven and far more likely to be the last thing that happens to everyone in the vehicle.
Run-Off-Road and Head-On Do Most of the Killing
Strip the rural toll down by crash type and it collapses into two. A vehicle leaves the lane to the left and finds whatever is waiting there – a ditch, a cut bank, a power pole, a macrocarpa planted when the road was still metalled. Or it drifts right and meets another vehicle closing at a combined speed north of 180 km/h.
Those two account for the clear majority of rural deaths and serious injuries. Intersections and turning movements are close to a rounding error past the town boundary.
Both respond to the same family of treatments: keep the vehicle in its lane, and if it leaves anyway, make certain what it reaches deforms rather than resists.
Why 100 km/h Changes the Physics, Not the Driver
Kinetic energy scales with the square of speed, which is the most consequential single fact in road safety engineering. A vehicle leaving the seal at 100 km/h carries four times the energy it would at 50, and something has to absorb that difference or pass it to the occupants.
Human tolerance is the fixed variable. The body’s survivable limit sits near 50 km/h for a side impact and near 70 km/h for a head-on. Those thresholds do not shift with experience or local knowledge of the road.
So the open-road speed environment is not a behavioural setting. It is a design input, and it sets how forgiving everything within a few metres of the lane edge has to be.
The Roadside Is the Part That Kills You
What Engineers Mean by an Unforgiving Roadside
The technical term is the clear zone: the width of ground beside the lane that a departing vehicle can cross without striking something solid or rolling. On a flat rural road at 100 km/h the desirable clear zone runs to about nine metres. Across much of the New Zealand network it is nearer one.
What occupies that space is unglamorous and lethal:
– power poles along the fence line, where the utility corridor runs
– culvert headwalls with a square concrete face to the road
– batter slopes steep enough to trip a vehicle into a roll
– drainage channels that catch a wheel and turn a run-off into a tumble
None of it was placed maliciously. Most of it predates any formal roadside safety standard, and the road grew around it.
Roads That Were Never Designed, Only Widened
Very little of the rural network was designed in the sense an engineer would recognise. It was surveyed, formed, metalled, sealed and widened in increments across a century, each generation inheriting the alignment set by the last. Curve radii were decided by the terrain and by whoever held the title in 1910.
The result is a network whose geometry is essentially historical. Sight distances suited to a horse-drawn dray. Crests that hide oncoming traffic. Runs of curves where one is noticeably tighter than the three before it, which is the geometry most reliably associated with loss of control.
Retrofitting safety into that geometry is not error correction. It is buying your way out of a century of accumulated compromise, one section at a time.
The Safe System Answer: Assume the Mistake
The Safe System approach that underpins New Zealand’s road safety strategy, and most of the OECD’s, starts from a premise that sounds obvious and is quietly radical. People will make mistakes, and the transport system should be built so those mistakes are not fatal.
Applied to a rural road, that reframes the question. The engineering task stops being the prevention of every departure from the lane and becomes making sure a departure produces a written-off vehicle and a badly shaken driver instead of a funeral.
Nobody designs human error out of 94,000 kilometres of road. But in specific places, at a known and quotable cost, you can design out the pole.
The Engineering Toolbox at Rural Scale
Paint, Studs and Noise: The Cheap End
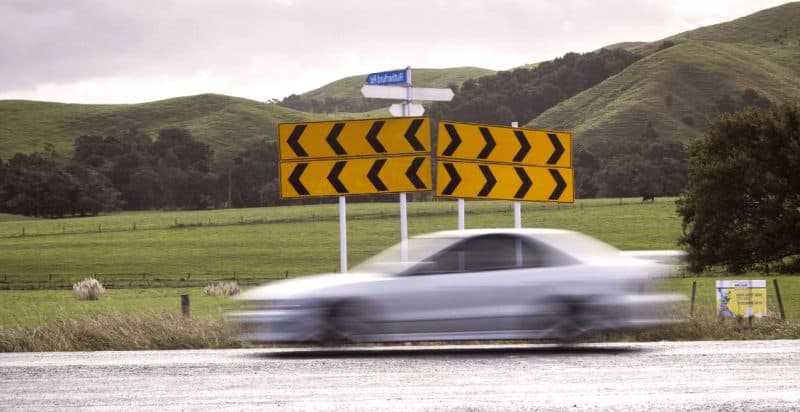
The cheapest interventions work on where the vehicle sits within the lane. Audio tactile profiled markings – the milled rumble strips on centrelines and edge lines – give an unmistakable noise and vibration the instant a wheel crosses. Wide centrelines put a metre or so of painted separation between opposing traffic. Raised reflective markers hold the alignment visible through rain and at night.
Per kilometre these sit in the tens of thousands of dollars, which is what makes them the workhorse of rural safety programmes. They can be applied as mass action across a whole corridor rather than one section at a time.
The tradeoff is that they act on the likelihood of a crash, not its severity. They keep vehicles in the lane and do nothing about what is sitting beside it.
Shoulders and Geometry: The Expensive Middle
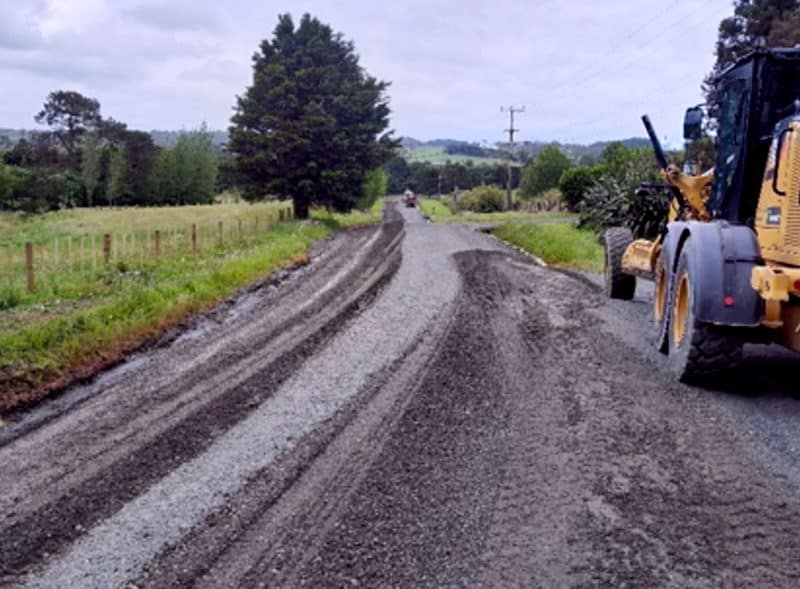
Sealed shoulder widening is the treatment most rural road controlling authorities want and least often afford. A metre or more of seal gives a wandering vehicle somewhere to recover and removes the edge break that drags a wheel off the pavement in the first place.
It also means genuine construction: subgrade, basecourse, drainage, sometimes property acquisition, always traffic management. Costs run into the low millions per kilometre on easy country and well beyond that where the road is cut into a hillside.
Curve realignment sits above that again. Straightening one bad bend can absorb the entire safety allocation of a small district for a year, which is why it usually arrives attached to a renewal project rather than a safety case of its own.
Barriers and Hazard Removal: Treating the Consequence
If the vehicle is going to leave the lane, the remaining question is what it meets. Flexible wire rope barrier has changed rural outcomes more than anything else in the toolbox: it catches the vehicle, deflects, and bleeds energy off over distance instead of stopping it dead. In the median it turns a head-on into a sideswipe; on the left shoulder, a run-off into a long scrape along a fence line.
The alternative is removing the hazard outright – relocating power lines, swapping rigid sign posts for frangible ones, laying back a batter, grating a culvert headwall.
Barrier runs to the high hundreds of thousands per kilometre installed. Hazard removal is priced by the object, which is why an authority with a modest budget and honest crash data can still shift the numbers with it.
The Arithmetic That Decides Which Kilometres Get Treated
The Ranking Machine: NLTF, GPS and the Investment Framework
Nearly all of this is paid for out of the National Land Transport Fund (NLTF), the pool assembled from fuel excise duty, road user charges and vehicle registration. Every three years the fund is committed through the National Land Transport Programme (NLTP), and what the NLTP may prioritise is set by the Government Policy Statement on land transport (GPS), the document in which the government of the day states what it wants the money spent on.
Proposals are then scored through the Investment Assessment Framework (IAF), which weighs the strength of a case against the priorities the GPS has fixed. Local road projects also carry a Funding Assistance Rate (FAR), the share the NLTF contributes, with the balance falling on the local ratepayer.
Five acronyms, one consequence. A quiet rural section competes nationally, on a scoring system, against every other claim on the same finite fund.
Why Cost Per Kilometre Beats Cost Per Life Saved
The benefit-cost case for rural safety work is usually strong on paper. A prevented fatality carries a large social cost saving, and treatments with long asset lives spread that benefit across decades. The difficulty is the length of road the sums have to work across.
Urban safety spending is concentrated. Treat one intersection and you have dealt with a crash cluster occupying a few thousand square metres. Rural risk is distributed along a line: the crashes on a fifty kilometre corridor are spread across all fifty kilometres, and no single location accumulates enough history to rank on its own.
That is why rural investment is increasingly assessed on collective and personal risk across a whole route rather than on blackspot counts. Applied to a rural network, blackspot analysis finds almost nothing, because the deaths are everywhere and nowhere.
Ninety Thousand Kilometres and a Finite Fund
New Zealand has roughly 11,000 kilometres of state highway and something over 83,000 kilometres of local road, most of it rural. Against that, the safety component of any three-year programme treats hundreds of kilometres. Not tens of thousands.
The arithmetic is not close. At a few hundred thousand dollars per kilometre for barrier, treating even the highest-risk tenth of the rural network would consume the whole land transport budget several times over. So the system triages, and the sections that lose are the ones carrying real risk and low volume: the road with two deaths in a decade and four hundred vehicles a day.
Those roads do not rank. They are not safe, they are simply not busy enough to rank.
The quiet roads are not dangerous because they are quiet. They are dangerous because being quiet is what keeps them at the bottom of every ranked list, year after year, while the seal narrows and the poles stay where the linesmen put them. Somewhere in a district council’s forward programme there is a section with a real crash history, a defensible business case and no money against it.
5 Comments
The hazard removal para is the bit that lands for us. Barrier money we are never going to see, but we got frangible posts and two culvert extensions done last FY out of the maintenance line and it barely touched the budget. The cheap wins are there if you have got the crash data to point at.
Fair article, but wire rope on the left shoulder is not the free lunch it sounds like. We farm off SH2 south of Masterton and every barrier run means another gap engineered for the gateway, or a long detour for the stock truck. Not saying dont do it. Just that the access and maintenance cost lands on someone, and it is generally not the people running the benefit cost.
Neville, that access issue is real and it is genuinely solvable – the gaps get designed in, they just cost more per kilometre than a continuous run, so they are the first thing value engineered out. Worth pushing your RCA on it at the consultation stage rather than after the posts are in the ground.
Nine metres desirable, nearer one in reality. That single line explains more about our local road than three years of council meetings managed to.
Good explainer on the IAF. Question though. If the FAR sits around half for a small rural district, where is the local share actually meant to come from? Our rating base is tiny and the roads are long. Does the framework account for that at all, or does it just quietly mean we never qualify?