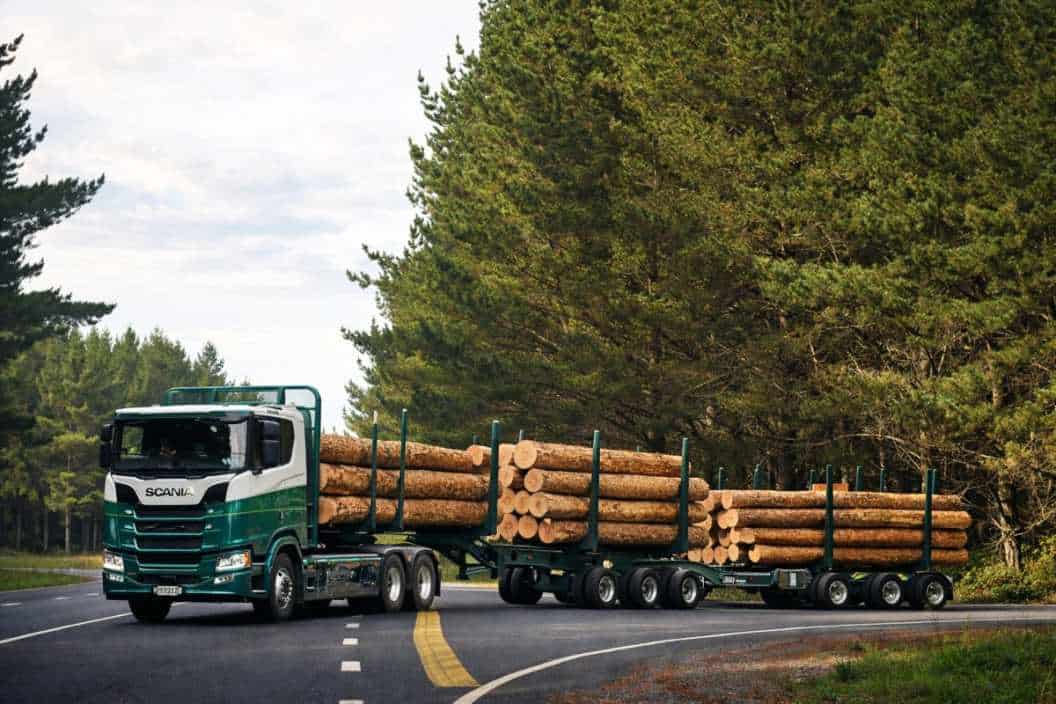
Fifty Tonnes and a Permit: How Heavy Freight Moves Through the Regions
A bridge on a back road in Southland can decide where a processing plant gets built. Not the motorway network, not the port, not the route planning software – a single structure poured decades ago, with a load rating that never caught up with the trucks now on the road. The high productivity vehicle regime is usually explained as a rule about trucks. It is really a rule about the condition of the network underneath them.
The Permit Is Really About the Bridge
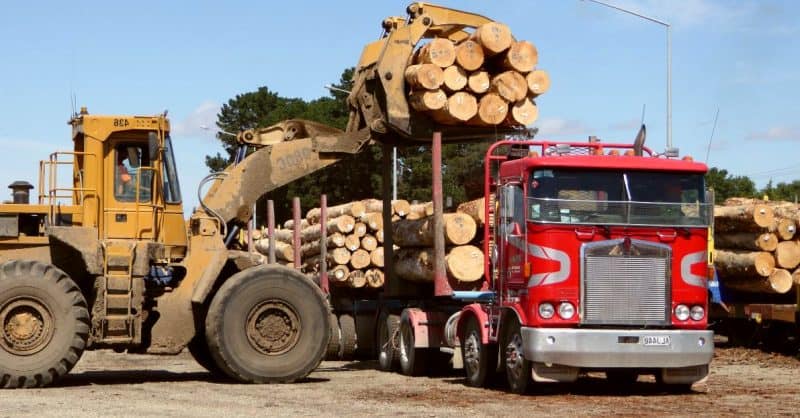
What High Productivity Actually Means
The term is administrative and it buries a straightforward idea. A high productivity motor vehicle (HPMV) is a truck and trailer combination permitted to run heavier, longer, or both, than the general limits applying to everything else on the network – and permitted to do it only on routes approved for it in advance.
The productivity in the name is arithmetic rather than engineering. Carry more per trip and you make fewer trips: less fuel per tonne moved, fewer driver hours consumed, fewer heavy vehicles in the traffic stream for the same freight task. For a milk tanker running the same loop three times a day through spring, that difference compounds fast across a season.
Nothing about the vehicle gets quicker. The gain sits entirely in the payload, which is why the regime is administered as a question about roads rather than a question about trucks.
Why the Route Is the Regulated Thing, Not the Truck
A permit for a heavier combination is not a licence that travels with the vehicle. It is tied to a defined route, because the road controlling authority – the New Zealand Transport Agency on state highways, the district or city council on local roads – has assessed the structures along that route and concluded they can carry the loading.
This surprises people who assume the truck is the regulated object. The vehicle is engineered and certified once. The network is assessed piece by piece, by dozens of separate organisations with different budgets, different asset data and different appetites for risk.
The result is a patchwork. A combination cleared to run the length of a state highway can lose that clearance the moment it turns onto the council road reaching the actual farm gate or quarry face. Freight route planning here is less about distance than about which links in the chain have been cleared, and by whom.
How a Bridge Gets Rated
Every bridge carries a number most people never see: an assessment of what it can safely bear, derived from the loading standard it was designed to, the condition of its members now, and how weight spreads across the span.
Much of New Zealand’s regional bridge stock was designed decades ago, to standards written for the trucks of that era. Timber and early concrete structures on rural routes were never conceived with modern eight and nine axle combinations in mind. Some have been strengthened. Many have been assessed, found adequate for general traffic, and left as they are – a rational call when the alternative runs to several million dollars.
When an assessment concludes a structure cannot take heavier loading, the road does not close. It simply is not included in the approved route. A posting, signed at the approach, is the visible version of the same judgement – the point where an engineering assessment becomes an economic fact for everyone using that road.
Pavements Wear Differently From Bridges
Bridges fail an application outright. Pavements do something subtler: they wear, at a rate wildly disproportionate to the load.
The relationship engineers work with came out of the AASHO Road Test run in Illinois in the late 1950s, and it approximates a fourth-power law – double the load on an axle and you do something like sixteen times the damage to the surface beneath it. That single relationship explains most of what happens to regional roads. A thousand cars a day are near enough irrelevant to a pavement. A dozen loaded trucks are not.
It is also why heavier combinations are not obviously bad for the asset. Loading spreads across more axles and total trips fall. Whether a route comes out ahead depends on axle configuration, pavement depth and what the subgrade is made of – which across much of provincial New Zealand means whatever river gravel was closest when the road was first formed.
One Sub-Standard Structure, One Long Detour
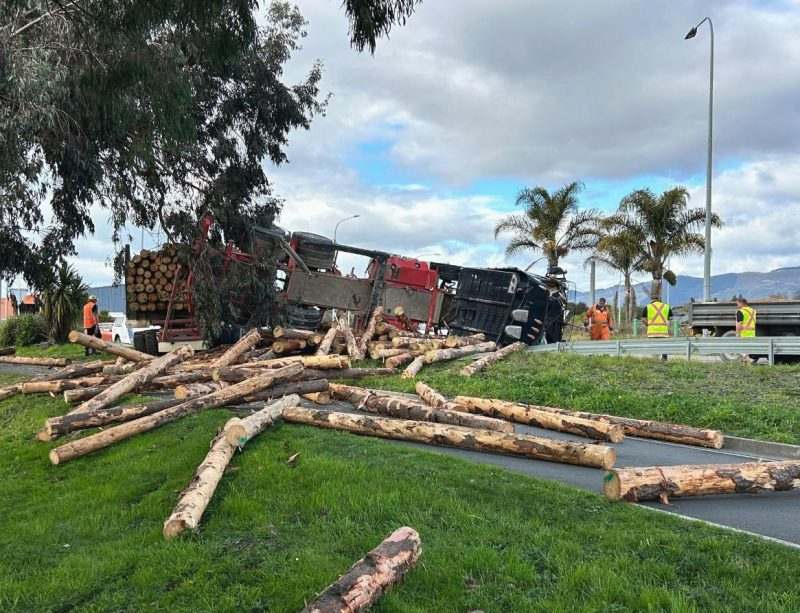
A Route Is Rated at Its Worst Link
A permitted route is a chain rated at its worst link. Ninety-eight kilometres of strengthened structures and rebuilt pavement count for nothing if one bridge in the middle cannot carry the loading. The freight either runs at standard weight or goes somewhere else.
Somewhere else is rarely next door. Regional networks are sparse – rivers, ranges and nineteenth century settlement patterns determined where the crossings went, and there are usually only one or two of them. Northland, the East Coast and inland Otago all have corridors where the alternative to a single structure is an hour or more of extra running.
The asymmetry is the thing to hold onto. One asset, perhaps a couple of million dollars to replace, sets the economics of every load that needs to cross it, in both directions, for decades.
What a Detour Actually Costs
Operators do this sum quickly, because they have to. A detour adding sixty kilometres each way is not a sixty kilometre problem. The components stack in ways that do not show on a map:
– Fuel and running cost over the extra distance, on every trip, indefinitely
– Driver hours, which are capped by work time rules and cannot simply be extended
– Trip frequency, where a longer loop turns three runs a day into two
– Fleet utilisation, since the same capital now covers less freight
Once a detour pushes a round trip past what a driver can legally complete in a shift, the cost stops being incremental. It becomes another vehicle, another driver, or a decision not to service that customer at all.
That threshold effect is why two routes with similar detour distances produce completely different commercial outcomes. It depends entirely on where the shift boundary happens to fall.
Why Some Structures Never Get Upgraded
The funding logic is neither mysterious nor malicious. Investment from the National Land Transport Fund – the pool that fuel excise, road user charges and vehicle registration feed into – is allocated against assessed benefits, and benefits are counted largely in the traffic using the asset. A bridge carrying four hundred vehicles a day struggles against one carrying forty thousand, whatever the freight riding over it is worth.
Local roads compound it, because councils fund their share from rates. A district with twelve thousand ratepayers and eleven hundred kilometres of road cannot strengthen structures at the rate the freight task is changing, and no amount of national policy rhetoric alters that arithmetic.
There is a real argument that benefit assessment undervalues freight productivity on low-volume routes, where the traffic count is small but the economic dependence is total. It has been made repeatedly, with limited effect on where the money lands.
The Map That Freight Draws
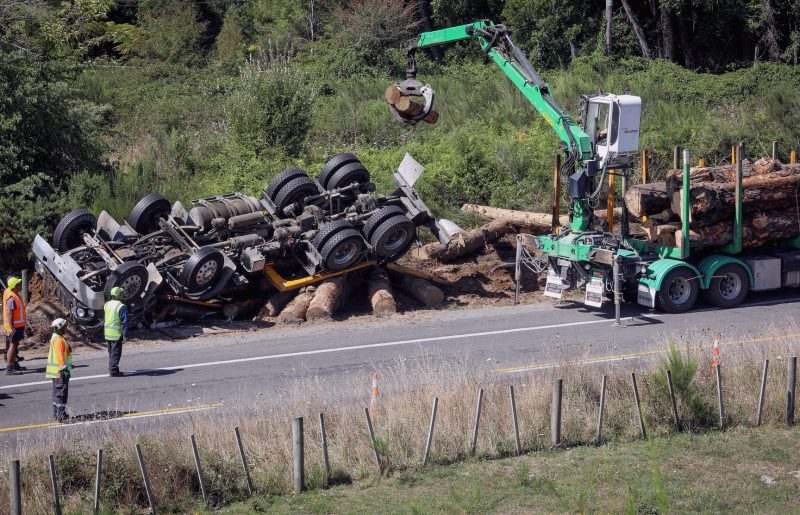
Processing Capacity Follows the Network
Look at where processing capacity sits in provincial New Zealand and you are looking at a map of what the network could carry when the investment decision was made. Dairy factories, meat works, packhouses and log yards cluster on corridors able to take the heaviest legal loading, because moving raw product is the cost that decides whether a site works at all.
That runs opposite to how transport investment is usually described. The standard framing has infrastructure responding to demand – the freight exists, so the route gets upgraded. A great deal of the causation runs the other way. The route was capable, so the plant went there, so the freight exists to justify the route.
For anyone choosing a site, the question is rarely whether a road reaches the property. It is whether the road reaches it at the weight that makes the numbers work, and how far that condition holds before it breaks.
How the Gap Compounds
Once the sequence is visible, the regional pattern stops looking like bad luck. A corridor with a sub-standard structure attracts less processing investment. Less processing means less freight. Less freight means a weaker case at the next funding round, so the structure stays as it is, and the gap between that corridor and the one over the range widens by another cycle.
None of this is anyone’s decision. Each assessment is defensible on its own terms. The outcome is still that some catchments accumulate capacity while others slowly lose the ability to compete for it, and the mechanism is a handful of bridges nobody outside the district has heard of.
It also means the cost of deferral is not flat. A structure left unstrengthened for fifteen years does not cost fifteen years of maintenance savings. It costs whatever located elsewhere in the meantime.
What Would Actually Shift It
The unit of analysis is wrong, and that is the fixable part. Assessing bridges one at a time, against the traffic counted on their own approaches, systematically misses the value of the corridor they sit in. A structure that looks marginal in isolation may be the only thing standing between a hundred kilometre route and full permitted status.
Corridor-level programmes – identifying the two or three constraints that would open an entire freight route, then funding them as one package – price the problem the way freight actually experiences it. Some regional programmes have been built that way, and the difference in outcome shows.
The harder change is data. Traffic counts are cheap and freight value is not, so assessments lean on what is easy to measure. Until the tonnage and the value crossing a rural structure are understood as well as the vehicle count is, the assessment will keep answering a question nobody in the region was asking.
None of this is a story about trucks. It is a story about a network assembled over a hundred and fifty years, assessed asset by asset, and asked to carry a freight task that reorganised itself in thirty. The permit sitting in the cab is the last visible step in a long chain of engineering judgements made before anyone imagined that load. Somewhere on most regional routes there is a single structure quietly setting a limit on what the district can produce, and it usually announces itself with a number on a sign that nobody reads twice.
3 Comments
The threshold thing is exactly right. We run a job where the detour puts the driver about eleven minutes past what he can legally do in a shift, and those eleven minutes cost us a second unit. Nobody outside the industry believes that until you put the roster in front of them.
Good piece, and the line about assessments answering a question nobody in the region was asking is uncomfortably accurate from where I sit. We can tell you the vehicle count over every structure in the district, and almost nothing about what is actually riding on them.
Fair, but I’d push back a bit on corridor packages being the fix. Bundling three structures together just makes a bigger number for the funders to say no to. Seen that happen twice up our way.