Putting a Price on a Life: Inside the Monetised Benefits and Costs Manual
A transport engineer in Gore and a project manager in Auckland are, on paper, asking the National Land Transport Fund for the same thing: money. The Monetised Benefits and Costs Manual is how New Zealand decides which of them has the better case, and it does that by converting saved minutes, avoided crashes and cleaner air into dollars. Depending on who you ask at the conference bar, that is either an admirable act of intellectual honesty or a category error dressed up in spreadsheets.
The Problem the Manual Exists to Solve
Comparing a Roundabout to a Rail Extension
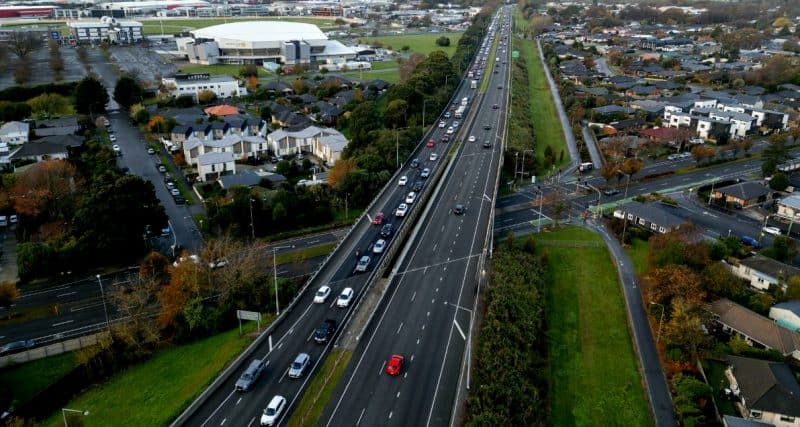
There is no natural way to compare a $3 million roundabout in Feilding with a $300 million rail extension in Auckland. One prevents a handful of crashes a year. The other moves thousands of people faster. Different in scale, different in kind, both competing for the same pot of money.
The Monetised Benefits and Costs Manual, published by NZTA Waka Kotahi, solves this by insisting everything be expressed in one unit: dollars. Every benefit gets a value. So does every cost. Divide one by the other and you have a benefit-cost ratio, a single number that lets a roundabout and a rail line stand in the same queue.
That is the whole trick, and most of the argument about the manual is really an argument about the trick.
Where the Manual Came From
Anyone who has been in the sector a while has used its ancestors. The Project Evaluation Manual gave way to the Economic Evaluation Manual, which was restructured and renamed as the Monetised Benefits and Costs Manual, the MBCM if you sit through enough funding meetings to earn the acronym.
The rename was not cosmetic. The older manuals read as a procedure for road projects with other modes bolted on afterwards. The current version is organised around benefit types rather than project types, which makes it possible to appraise a bus lane, a cycleway and a passing lane using one logic rather than three sets of workarounds.
It sits beneath the Investment Assessment Framework, the scoring system used to rank funding applications, and supplies the economic half of that score.
What Gets Counted, and Against What
Nothing in an appraisal is measured in isolation. Every number is the difference between two futures: the world with the project, and the world without it. That second world is the do-minimum, which is not doing nothing but continuing the minimum maintenance and renewal needed to keep the asset working.
Choose a soft do-minimum and your project looks heroic. Choose a hard one and the same project barely registers. A surprising amount of appraisal argument happens right there, long before anyone reaches the interesting questions about the value of a life.
Costs are the easier half of the sum:
– construction and land purchase
– maintenance and renewal across the asset’s life
– disruption while the work is under way
The benefits are where the manual earns its length.
Turning Human Outcomes Into Dollars
The Value of a Statistical Life
The value of statistical life is the most misread number in transport appraisal, and the misreading is understandable. It sounds like a price tag on a person. It is not.
It answers a much narrower question: how much a population is collectively willing to pay to reduce the chance of a death, spread across everyone who benefits. Ask several thousand people what they would pay for a change that cuts their annual risk of dying on the road by one in a hundred thousand, multiply the answers out, and you arrive at a figure per statistical life. Nobody’s life was priced. A risk reduction was.
New Zealand’s figure traces back to a willingness-to-pay survey of the general public rather than to anything a court or an insurer would recognise, and it is updated against wage movements rather than reset by fresh survey. It works alongside separate values for serious and minor injuries to form what the sector calls the social cost of crashes.
Travel Time Savings, One Minute at a Time
In most road projects, travel time savings are not one benefit among several. They are the benefit, routinely the majority of the total and sometimes overwhelmingly so.
The logic is simple. A project saves each vehicle a small amount of time. Multiply by the vehicles, by the people inside them, by a value per hour, by every day for decades, and small numbers become very large ones. The hourly value is not fixed: it varies by trip purpose, because time spent driving on the job is worth more than time spent driving to the beach, and it rises in congestion, because unreliable travel is worse than merely slow travel.
The obvious objection is that a minute saved by four hundred drivers is not an hour saved by seven. Nobody reorganises their day around ninety seconds. The manual’s answer is that the aggregate is real even when no individual notices it, which is defensible, and still the thing most likely to make a sceptical councillor put the report down.
Emissions, Noise and the Late Arrivals
Crash and time values have been in these manuals for decades. The environmental values are newer, and it shows.
Carbon is priced, but the value used is a policy choice rather than an observed market outcome, and it moves with the emissions price and with government guidance. Air quality is handled through the health effects of vehicle emissions on people living near the road. Noise is valued largely through what quieter houses sell for.
These are the most contested numbers in the manual, for two reasons. The evidence behind them is thinner, and they are usually small enough relative to travel time savings that they rarely shift a ratio. A cycleway’s carbon benefit is genuine. It is also close to a rounding error beside the time savings claimed on a state highway.
The Arithmetic That Decides Everything

The Discount Rate Does the Heavy Lifting
Benefits arrive over decades. Costs mostly arrive at the start. To compare them, future dollars are discounted, shrunk by a fixed percentage each year on the reasoning that a benefit in 2060 is worth less today than the same benefit next year.
The discount rate sounds like a technical footnote. It is closer to a policy instrument. A high rate crushes benefits that arrive late, which disadvantages long-lived assets such as bridges, rail and anything built to last a century, and flatters projects that deliver quickly. New Zealand ran a notably high rate for years, above what comparable countries used, before revising it down toward the rates Treasury publishes for public sector appraisal.
That single change reordered projects across the country without anyone touching a road.
Forty Years and Then Nothing
Alongside the rate sits the evaluation period: how many years the appraisal counts before it stops looking. Forty years is the usual convention, with a residual value added at the end to represent whatever useful life the asset still has.
Both choices are defensible and both are arbitrary at the edges. A structure designed for a century has sixty of those years appraised at zero, softened only by that residual figure. Combine the horizon with discounting and the effect is stark: benefits arriving beyond roughly the third decade contribute almost nothing, however real they turn out to be.
This is not an oversight. It is an explicit judgement that distant, uncertain benefits should not drive present spending. Worth remembering when a report tells you a project does not stack up.
What a Benefit-Cost Ratio Does Not Tell You
A ratio above one means the monetised benefits exceed the monetised costs. It does not mean the project should be built, and the manual has never claimed otherwise.
The ratio is one input into the Investment Assessment Framework, which also weighs how well a project fits the Government Policy Statement on land transport, the document that sets the government’s priorities and the funding available to each activity class. A strong ratio can still lose to a weaker one that sits closer to the priorities of the day.
The other thing a single number hides is its own fragility. Change the do-minimum, the discount rate or the traffic forecast and a ratio of 1.4 becomes 0.8. Any appraisal worth reading shows that sensitivity. Any summary that reports one number without it is selling something.
What the Numbers Flatten
A Dollar Is a Dollar, Whoever Gets It
Cost-benefit analysis is deliberately blind to who receives the benefit. A minute saved by a freight operator counts exactly the same as a minute saved by a caregiver driving to a night shift. Aggregate welfare rises either way.
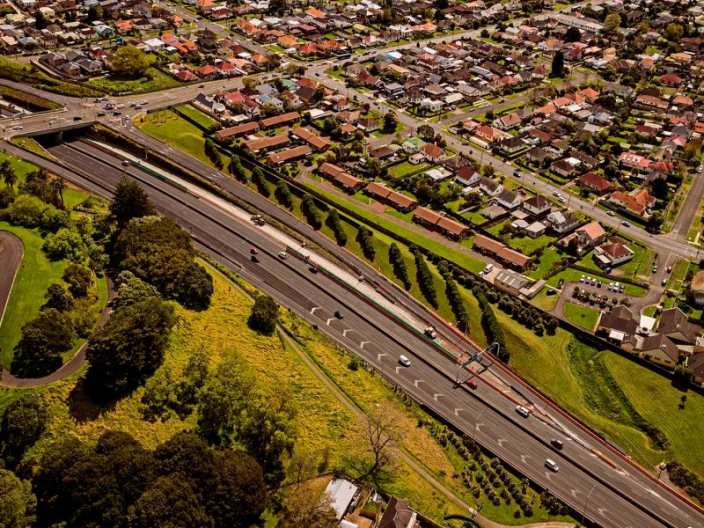
The consequences fall along predictable lines. Travel time benefits scale with traffic volume, so a route carrying thirty thousand vehicles a day generates numbers a route carrying eight hundred cannot reach. The rural route may be the only sealed link to a hospital, or carry a district’s entire export season on a truck. None of that appears in the ratio.
The manual does not hide this. Distributional effects sit outside the monetised result, described separately and weighed by decision-makers, which is another way of saying they are weighed by judgement, politics, and whoever briefs best.
The Things That Resist a Price
Some effects have no defensible dollar value, and the manual is honest enough not to invent one.
Community severance, which is what happens when a four-lane road separates a school from the houses whose children attend it, has no reliable market analogue. Neither does landscape character, nor the loss of a site that matters to mana whenua, nor the slow hollowing of a main street that becomes a through route. These are recorded as non-monetised impacts: described, assessed qualitatively, attached to the appraisal.
The problem is structural rather than dishonest. A number and a paragraph do not compete on equal terms. The ratio goes in the summary and the paragraph goes in an appendix, so anything that resists monetisation gets quietly demoted, not because someone decided it mattered less, but because the format has a shape and prose does not fit it.
Why It Still Beats the Alternative
None of this argues for abandoning the exercise. It is worth remembering what transport decisions look like without a manual: made on the strength of advocacy, proximity to a minister, and how loudly a region can complain.
The discipline of monetisation is that it forces the assumptions into the open. A stated value of statistical life can be argued with. A discount rate can be challenged. A traffic forecast can be checked against what actually happened on the last three projects. Political intuition cannot be audited at all.
The manual reads best as a structured argument rather than an answer, a way of making the reasoning visible enough to disagree with precisely. Used that way it is genuinely useful. Used as a verdict, it does exactly what its critics say it does.
The uncomfortable thing about the manual is not that it puts a number on a life. It is that it does so more carefully, and with more visible working, than almost any other decision the transport sector makes. Those numbers deserve every bit of the scrutiny they attract, but the scrutiny is only possible because somebody wrote them down. Most of what determines where the money actually goes never gets that treatment.
4 Comments
The do-minimum point is the one I’d underline for anyone new to this. I sat through two workshops this year where the entire disagreement was about whether a renewal programme belonged in the base case or the project, and nobody said the words benefit cost ratio once. Everything downstream had already been settled by then.
Fair summary, though you’re a bit generous on travel time savings. That aggregation argument has been defended for thirty years and it still doesn’t survive contact with a real corridor. We are capitalising seconds that never turn into anything anyone can use.
Bill, I’d argue the aggregation isn’t the weak point – the forecast underneath it is. If your traffic growth assumption runs 15 percent high then the time savings are already 15 percent high before anyone gets to the philosophical question about whether ninety seconds is real. We checked three of ours against actual counts last year and it was not a comfortable afternoon.
The bit about the appendix is exactly right. I’ve written those non-monetised sections and I know perfectly well nobody reads past page four.