
The Shape of New Zealand’s Road Network
New Zealand maintains around 94,000 kilometres of public roads — a network larger per capita than the United Kingdom, Denmark, or Australia, managed by two distinct ownership structures and shaped by a geography that has never been kind to transport planners. Understanding that network means understanding why it is the size it is, who is responsible for which parts, and how the system that classifies roads by function rather than ownership has changed the way investment decisions get made.
Ninety-Four Thousand Kilometres
Putting the Number in Context
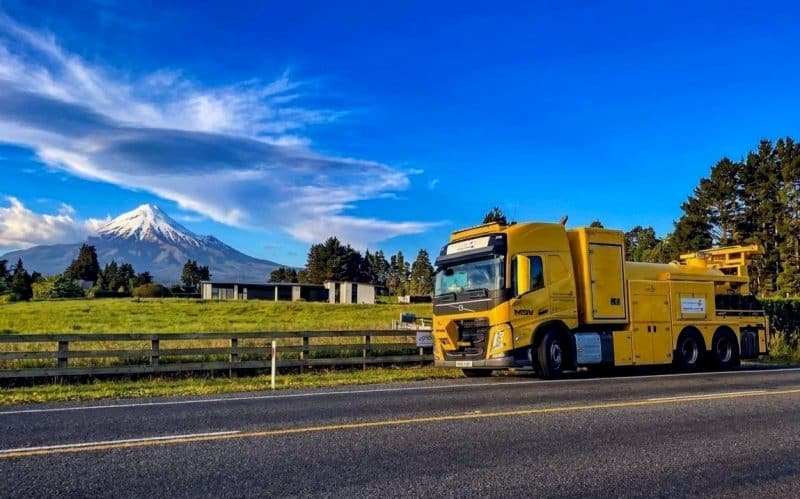
New Zealand has around 94,000 kilometres of public roads. For a country of five million people, that works out to roughly 19 metres of road for every resident — a figure that sits comfortably above the United Kingdom at around 6 metres per person, and above Australia at approximately 8 metres per capita despite Australia’s vastly larger landmass. Denmark, another small, prosperous country with a functioning public transport system, manages with about 12 metres per person. None of these comparisons are exact — definitions of what counts as public road vary by jurisdiction — but the order of magnitude is consistent. New Zealand maintains an unusually dense road network for its population size, and the reasons for that are embedded in the country’s physical and economic geography rather than in any particular policy failure or extravagance. The $40 billion National Land Transport Programme that funds this network over three years represents one of the largest infrastructure commitments in the country’s history. That money goes toward a network that most New Zealanders interact with daily without thinking much about its scale or its complexity.
The Geography Problem
The explanation starts with a map. New Zealand is 1,600 kilometres long from Cape Reinga to Bluff and, at its widest, about 400 kilometres across — a long, narrow country running southwest to northeast, split into two main islands by the Cook Strait. The Southern Alps form a continuous spine down the South Island’s western side, pushing settlement toward the coasts and making cross-island corridors expensive to build and maintain. In the North Island, the volcanic plateau, the ranges of the Manawatu Gorge and the Remutaka Hill Road, and the deeply indented coastlines of Northland have had similar effects. These topographies do not forgive a sparse network. A coastal community with a river estuary on one side and a ridge on the other often has one road in and out — and that road needs to be maintained to a standard that keeps it passable through winter rain, spring flooding, and the occasional slip. Rail serves the major freight corridors between the main ports and cities, but it reaches nothing like the geographic coverage of the road network. For most of New Zealand outside the main urban centres — and that is most of New Zealand by area — road is not a transport option, it is the transport option.
What Gets Counted and What Does Not
The 94,000km figure comes from the national road network database maintained by the New Zealand Transport Agency Waka Kotahi (NZTA), and it includes sealed and unsealed roads, state highways and local roads, roads managed by territorial local authorities and roads managed by NZTA itself. What it excludes: private roads (including many farm access tracks and subdivision streets not yet vested in a council), temporary or seasonal roads, and most forestry roads that have not been built to public road standard. The unsealed proportion is substantial — roughly 40 percent of the network by length is unsealed. That matters for costs more than most people realise. Resealing a kilometre of sealed rural road costs several times less than grading and metalling an unsealed road requires across its service life, but the unsealed network is spread across terrain where construction to sealed standard would cost multiples of any rational benefit calculation. The result is a two-standard network: sealed arterials and collectors carrying the bulk of traffic and economic activity, and unsealed access roads doing the last-kilometre work in pastoral, forestry, and remote farming areas.
Two Owners, One Network
What NZTA Actually Controls
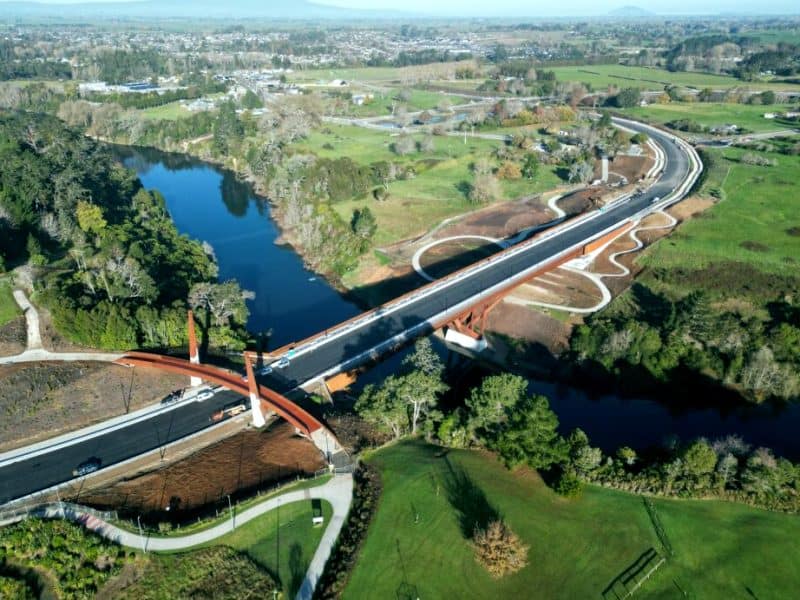
NZTA Waka Kotahi manages the state highway network — approximately 11,000km of the national total, or just under 12 percent by length. State highways carry a disproportionate share of traffic: roughly 40 percent of all vehicle kilometres travelled in New Zealand move on state highways. NZTA’s role covers the full spectrum of highway management: setting and enforcing speed limits, contracting maintenance and renewals, funding and overseeing major capital projects, operating traffic management systems, and issuing engineering standards that flow down to the whole sector. The funding mechanism for this work is the National Land Transport Programme (NLTP), which NZTA administers on a three-year cycle. The NLTP is not solely a state highway budget — it is the vehicle through which NZTA co-invests in local roads, public transport, walking and cycling, and road safety programmes across the country. But the state highway network is where NZTA has direct ownership and direct accountability. When a bridge washes out on State Highway 25A, or a landslide closes the Lewis Pass, it is NZTA’s problem to fix and NZTA’s resources that fund the response.
Councils and the Other 83,000km
The remaining 83,000km — nearly nine-tenths of the physical network — belongs to territorial local authorities: the 67 city and district councils and 11 unitary authorities that make up New Zealand’s local government structure. A city council like Auckland Transport, managing an urban network, operates with the rating base of 1.7 million people behind it. At the other end of the scale, the Mackenzie District Council maintains around 1,400km of roads — a significant portion unsealed, some at altitude, much of it exposed to harsh high-country winters — on the rates of roughly 5,000 residents. The Mackenzie District is not unusual. Grey District on the West Coast, Chatham Islands, Kawerau, Ruapehu: across rural New Zealand, the ratio of network length to ratepayer base is extraordinary. The funding model partially compensates for this imbalance. Councils receive Funding Assistance Rates (FAR) from NZTA, with rural and remote councils attracting higher co-investment ratios than urban ones. The Funding Assistance Rate for a major city council might sit at 51 percent. For a remote rural district, it can reach 75 percent or higher. But even at 75 percent co-investment, 25 percent of a large maintenance bill falls on a thin local rates base — and that arithmetic becomes visible in the state of the road.
Where Responsibility Gets Complicated
The state highway and local road distinction is cleaner in legislation than it is on the ground. In urban areas, state highways pass through suburbs, intersect with council-controlled roads, and share space with pedestrians and cyclists in ways that blur the operational boundary. The Northern Motorway through Auckland is unambiguously a state highway, but the intersections, ramps, and connecting arterials that make it functional involve councils, Auckland Transport, and NZTA in a sometimes awkward governance arrangement. Regional Transport Committees, established under the Land Transport Management Act, bring NZTA, regional councils, and local councils together to produce Regional Land Transport Plans — the regional tier of investment planning that sits between the NLTP and individual council programmes. The Roads of National Significance programme, pursued aggressively from 2009 onwards, added another layer of complexity by designating major highway projects as nationally significant and fast-tracking them through the planning process regardless of regional priority rankings. Whether that produced better outcomes than the standard prioritisation process would have is a question the transport sector has not fully resolved.
Ranking Roads by What They Do
The One Network Road Classification
The One Network Road Classification was developed jointly by NZTA and Local Government New Zealand from 2012 and progressively adopted from 2013, reaching full implementation by around 2015. Its fundamental innovation was straightforward but significant: instead of classifying roads by who owns them, it classifies them by what function they perform. The six categories — National, Regional, Arterial, Primary Collector, Secondary Collector, and Access — form a hierarchy of movement. A National-classified road moves people and freight across regions at high volumes and high speeds; think the Desert Road, the Southern Motorway, or SH1 through Canterbury. A Regional road connects cities and towns within a region. An Arterial carries traffic into and around urban areas. Collectors feed traffic from Access roads into the higher network. Access roads — the bottom of the hierarchy — connect individual properties and communities to the collector network. The classification applies regardless of whether a road is a state highway or a local road: a local road can be classified Regional if it performs a regional function, and a state highway segment can be classified Primary Collector if that is what it actually does. Before the ONRC, a state highway got state highway investment regardless of how much traffic it carried. The ONRC forced a more honest conversation about what each road actually does.
Why Classification Determines Funding
Classification is not administrative tidiness for its own sake. Under the ONRC framework, each classification level carries a set of customer level of service expectations — standards for travel time reliability, ride quality, safety, and resilience. These expectations directly influence the investment levels NZTA and councils are expected to apply. A road classified National should be able to sustain heavy vehicle movements at posted speed limits without significant travel time variability; delivering that standard on a challenging alignment costs real money. A road classified Access needs to be passable and safe; the investment threshold is lower. The funding implications flow through the Funding Assistance Rate system. NZTA uses ONRC classifications alongside traffic volumes and other factors when determining how much co-investment a council road attracts from the NLTP. Councils have therefore had a clear financial interest in the classification outcome for their roads since the system launched. The ONRC review processes, which councils can initiate, have not always been free of the suspicion that the argument being made is as much about funding as about genuine functional assessment. That tension is not a failure of the system — it is the system working as intended, with the expected level of vigour from local government.
What the Classification Does Not Settle
The ONRC addressed the old problem of ownership-driven classification but introduced new tensions of its own. Some roads are classified at a level that implies investment standards their controlling authority cannot fund. A district council road classified Regional carries service expectations designed for a more generously resourced manager; when the council cannot deliver those expectations, the gap shows up as deferred maintenance, safety issues, or community frustration. Reclassification downward has been the mechanism for resolving some of these mismatches — but downward reclassification reduces NZTA co-investment, leaving the council with a lower-classified road and less funding to maintain it. The classification also does not resolve the question of who should own a road that is functionally national but happens to sit in a local authority’s network. State highway transfers — moving a local road into the state highway network — occur occasionally but require NZTA agreement and are not automatic consequences of classification. The ONRC is the right framework. The sector broadly accepts that. But a framework for consistent classification is not the same as a solution to the funding gaps that sit underneath the classification debate.
The Local Road Reality
The Deferred Maintenance Problem
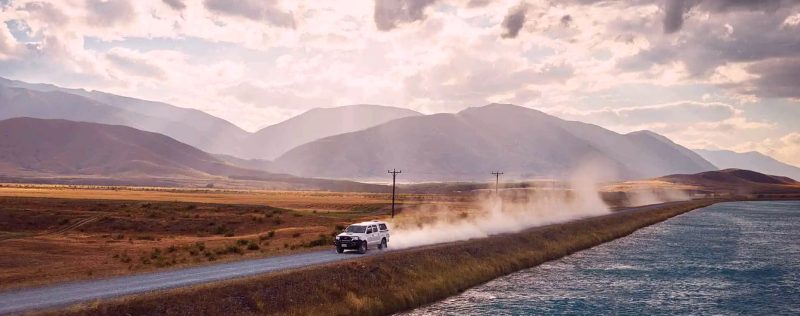
New Zealand’s road maintenance backlog is well-documented and growing. Local Government New Zealand has reported that council roading networks across the country are being maintained at levels below what is required to sustain their current condition, and the Infrastructure Commission Te Waihanga has identified the transport network as carrying significant deferred investment. The backlog is concentrated in the local road network — not because councils have been careless, but because the combination of rate-capped revenue, rising materials and labour costs, and increasing vehicle loads has outpaced funding over several cycles. Road seal ages out: a road built or resealed in the 1980s was designed for traffic volumes and vehicle weights typical of that era. Forty years later, carrying dairy tankers and logging trucks at axle loads the road was never engineered for, that seal deteriorates faster than standard maintenance intervals can address. The maintenance backlog is not, in the main, a management failure. It is a structural consequence of a funding model that was calibrated for a different traffic environment.
Rural Roads and the Freight Network
New Zealand’s primary industries export approximately $40 billion worth of goods annually, and almost all of it moves by road at some point in its journey — from farm gate to processing plant, from forest to port. Dairy tankers, often operating at maximum legal axle weights, make multiple daily runs on rural roads designed for much lighter vehicles. Logging trucks in regions like Northland, the Coromandel, and the Marlborough Sounds carry loads that impose pavement stress several times that of an equivalent number of car movements. The road damage from heavy vehicle loading scales non-linearly: an axle load of 10 tonnes does not do 10 times the damage of a 1-tonne axle — it does something closer to 10,000 times as much, by the standard pavement damage formula. Councils in high-forestry districts have been explicit about this tension. Kaipara and Far North districts in Northland have both raised the issue of forestry-related road damage as a fiscal pressure that their rating base cannot absorb. The economic activity that generates the freight also generates the damage, but the rates income from that activity does not translate directly into the road maintenance budget needed to manage it. A dairy farmer pays rates; the roading cost their tankers impose is spread across the council’s entire network.
When Extreme Weather Resets the Calculation
Cyclone Gabrielle in February 2023 delivered the most concentrated road network damage New Zealand had seen since at least the 1970s. Hawke’s Bay, Northland, and the Coromandel Peninsula suffered road closures, bridge failures, and slip damage across hundreds of kilometres of both state highway and local road. State Highway 25A on the Coromandel — a critical connector between Thames and Whitianga — was closed for over a year following a major slip at Taihoa Canyon. Dozens of smaller local roads in Hawke’s Bay remained closed or severely restricted for months, isolating rural properties and disrupting supply chains for orchards and vineyards whose growing season was already compromised. The central government committed emergency funding through a dedicated cyclone recovery package, and NZTA activated emergency procurement processes. But the event made visible something the sector already knew: significant portions of the local road network, particularly in regions with a history of deferred maintenance, had diminished resilience. Roads in adequate condition recover from extreme weather events more quickly than roads in poor condition. The maintenance backlog is not just a financial number — it is a measure of how exposed the network is when the next major event arrives.
The Network’s Future Shape
The Case for Network Rationalisation
Not every road in the network needs to remain a road in its current form. Some Access-classified roads carry fewer than 20 vehicle movements a day — figures that put the per-vehicle cost of maintenance at levels that would be difficult to justify under any rational investment framework. In Australia, several states have formally explored managed road rationalisation: downgrading low-volume sealed roads to all-weather gravel, reverting lightly-used gravel roads to formed tracks manageable as seasonal access, and in some cases closing roads and providing alternative access arrangements. New Zealand has not pursued this at scale, in part because the political economy is difficult: the residents at the end of a lightly-used road are real people with genuine access needs, and no elected council wants to be seen closing a road to a community. The Infrastructure Commission’s work on the transport network has touched on this question without resolving it. The honest observation is that some parts of the 94,000km network are there because they were built, not because the case for maintaining them at current standards still holds. That is a conversation the sector has not yet found an easy way to have.
Paying for Roads Differently
New Zealand roads are funded through two main streams: fuel excise duty (paid at the pump on petrol and diesel) and road user charges (RUC), paid per kilometre by diesel vehicles and heavier vehicles. Together, these flow into the National Land Transport Fund, from which the NLTP is financed. The model has worked reasonably well for decades — road use generates the revenue that maintains the roads. The EV transition disrupts this. Battery electric vehicles pay no fuel excise duty and, until recently, paid no road user charges. As EV uptake has grown, the funding gap has become visible. The government introduced distance-based road user charges for EVs from 2024, acknowledging the logic: if road funding is a user-pays system, then all road users should contribute proportionally to distance travelled, regardless of fuel type. The transition from a fuel-excise model to a universal distance-based model is technically and politically complex — it requires accurate distance tracking, a fair rate-setting process, and a transition path that does not penalise early EV adopters excessively. Several countries, including the UK and Germany, are working through the same problem. New Zealand’s shift toward universal road user charges is not a radical departure — it is the logical endpoint of the existing user-pays principle applied consistently.
The 94,000km road network is not a single thing managed by a single entity with a single budget. It is the accumulated result of geography, history, and a funding model stretched between the demands of a dispersed population and the realities of what rates and road user charges can actually sustain. The One Network Road Classification improved the framework for making investment decisions; it did not resolve the underlying tension between what the network requires and what is available to fund it.
4 Comments
The pavement damage formula point hit home. I’ve been on enough Northland back roads after logging season to understand viscerally why councils are struggling — the roads feel completely different before and after the trucks come through. What I hadn’t grasped before was the mathematical scale of that difference. 10,000 times is not a rounding error, that’s a categorically different problem from what the road was designed for.
Good piece. The section on Cyclone Gabrielle is accurate — I grew up in Hawke’s Bay and the road closures after the cyclone cut off whole communities for weeks. The point about diminished resilience is exactly right. Some of those roads were already borderline before the storm hit. If they’d been properly maintained they might have survived with much less damage.
The EV road user charges section is useful context. I switched to an EV two years ago partly because of the running cost saving, and paying RUC now does feel like the right principle even if the transition was abrupt. The user-pays logic makes sense — if you’re using the road, you should be contributing to its upkeep regardless of what’s in the tank.
The Mackenzie District example is striking. 1,400km of roads on a rating base of 5,000 people — even at 75% FAR that’s an enormous per-ratepayer burden. I’d be curious whether NZTA has ever seriously modelled what it would cost to transfer some of the most critical rural local roads into the state highway network, or whether the political barriers make that a non-starter before the analysis even gets done.