New Zealand’s Ageing Bridges: Inspection, Posting and the Replacement Backlog
There is a rhythm to driving a rural New Zealand road: the slow-down, the glance across the deck, the small negotiation with whoever reached the other end first. One-lane bridges get treated as scenery, or as a quirk of national character. They are neither. They are asset decisions taken seventy years ago that nobody has yet found the money to revisit.
The Bridge You Slow Down For
Why One Lane Was Enough in 1955
When most of these bridges went in, the design brief was different in every respect that matters. A county council with a small rating base was crossing a river to get milk to a factory and children to school.
Traffic counts were in the dozens per day, the heaviest vehicle was a stock truck at a fraction of today’s gross weight, and a second lane was an expense nobody could defend at the next ratepayers’ meeting.
Single lane was not a compromise then. It was the correct answer to the question being asked. The bridges were built to the loading standards of the day, by Ministry of Works crews or local contractors, in timber where timber was to hand and concrete where the money stretched.
The question changed underneath them. The bridges did not.
What a Give Way Sign on a Bridge Actually Tells You
The priority signs at either approach are the cheapest pieces of infrastructure on the site, and they carry a lot of freight. They tell you the deck is too narrow for two vehicles, that the approach geometry gives one direction better sight distance, and by implication that widening has been looked at and deferred.
What they do not tell you is anything about the structure’s strength. That is a separate conversation on a separate sign: a weight limit in tonnes, sometimes with a speed restriction attached.
Drivers read both as roughly the same message, which is be careful here. Asset engineers read them as two different problems with two different price tags.
The Numbers Behind the Nostalgia
New Zealand carries something in the order of eighteen thousand road bridges, and the split is the part people get wrong. Only a few thousand sit on the state highway network, where the funding is national and the inspection regime is tightly specified.
The great majority belong to councils, on local roads, held up by a rating base that in some districts amounts to a few thousand properties.
Totals vary depending on whether large culverts and stock underpasses get counted, which is why different agencies quote different numbers. The shape holds regardless. The country’s bridge problem is overwhelmingly a local road problem, concentrated in the districts with the least money and the most river crossings per kilometre – the West Coast, Northland, Tairawhiti, inland Otago.
How a Bridge Gets Looked At
The General Inspection: Eyes, Every Year
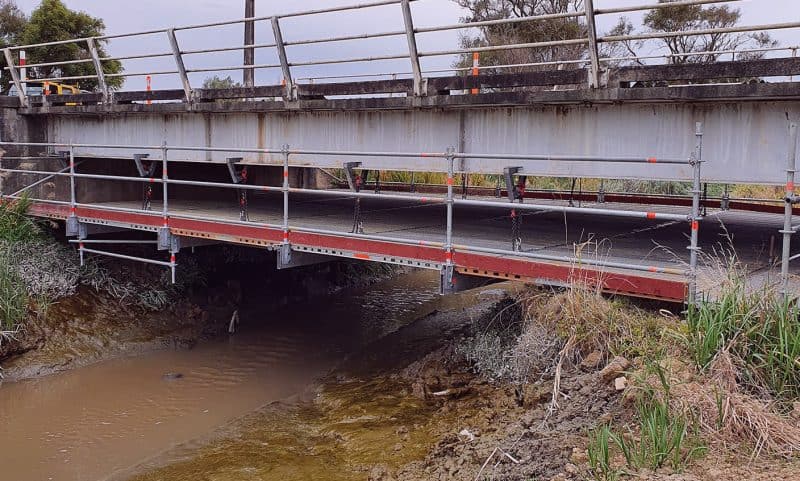
Every bridge in the country is meant to get looked at roughly once a year. The general inspection is a walk-over: deck, rails, approaches, abutments, the visible parts of the piers, whatever can be seen without access equipment. It is done by a trained inspector rather than a chartered structural engineer, and it produces a condition rating and a list of things to watch.
Unglamorous is the point. The general inspection is a tripwire. It catches the scour hole that opened up after the last fresh, the handrail a truck clipped, the timber pile gone soft at the waterline, the expansion joint packed with gravel.
Findings are logged against the asset in the council’s maintenance database, which is where the next inspection cycle starts reading.
The Principal Inspection: Closer, Slower, Every Six Years
Once every six years or so, the same bridge gets a much more expensive kind of attention. The principal inspection is hands-on: an experienced structural engineer within arm’s reach of every element, which on a river crossing means an underbridge unit, a boat or a harness, plus traffic management for however long it takes.
On state highways the regime is set out in the NZ Transport Agency’s bridge design and evaluation manual, and most councils work to the same standard.
The output is not a tidy pass or fail. It is a component-by-component assessment and, where the engineer has concerns, a recommendation for a load capacity evaluation – the work that decides whether a bridge stays open to everything.
What Inspectors Are Actually Hunting For
Three failure paths account for most of the anxiety. Scour is the first and the worst: moving water taking the riverbed out from under a pier or abutment, invisible at low flow, and the reason bridges get inspected after major floods rather than only on schedule. A pile can lose several metres of support without anything showing on the deck.
Corrosion is the second. Reinforcing steel in coastal concrete takes up chloride, expands as it rusts, and spalls the cover off from the inside, which is why structures in Northland and on the Coromandel age faster than inland contemporaries of identical design.
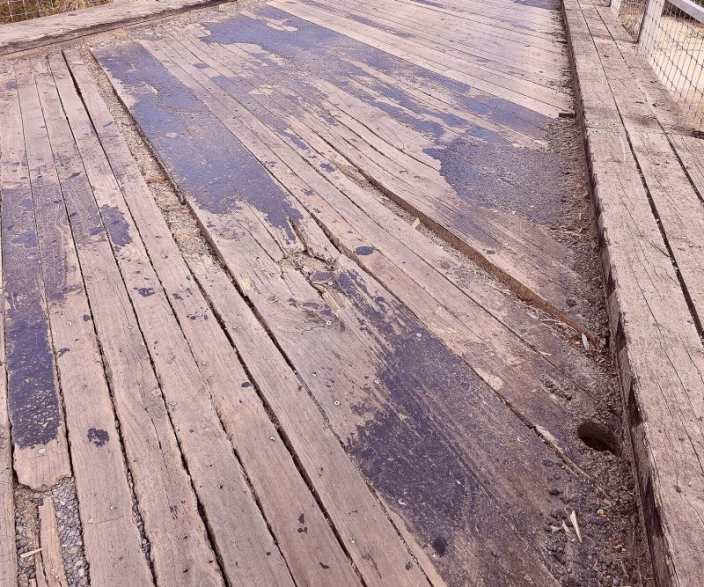
The third is time doing what time does to timber and riveted steel: decay at the waterline, soft heartwood in piles, fatigue cracks at connections that have flexed under a million truck axles.
Posting a Bridge: When the Load Comes Down
How a Weight Limit Gets Set
Posting a bridge is the end of an arithmetic exercise, not a judgement call. An engineer takes the as-built drawings, the condition recorded at the last principal inspection and the material properties that can actually be verified, then calculates what the structure will carry with an acceptable margin. That number is compared against the load classes legally using New Zealand roads:
– Class 1 general access, the 44-tonne configuration that travels anywhere without a permit
– High productivity vehicles, up to 50 tonnes on approved routes under the 50MAX rules
– Heavier and oversize loads, moving only by permit over checked structures
A bridge that cannot carry Class 1 gets a gross weight limit in tonnes on a sign. One that carries Class 1 but nothing above it gets no sign at all. It simply drops off the permitted freight routes.
What Posting Means for a Farmer at Harvest
For the people who live up the road, a posted bridge is not an engineering fact. It is a logistics tax paid every season.
A milk tanker at full load sits above a good many of the limits posted on local roads, which means a smaller tanker doing more trips, a route redesigned around the crossing, or the farm coming off the schedule. A stock truck crossing half loaded is two trips instead of one.
Harvest contractors turn up with gear nobody had in mind when the sign went up – foragers, chaser bins, spreader trucks – and they charge for the extra travel because they have to.
None of that appears in a maintenance budget. It appears in farm gate margins.
The Freight Detour Nobody Costs Properly
Freight operators run the same sum at a larger scale, and it is the part of the system accounted for least well. A restriction on one crossing can add thirty or forty kilometres to every load out of a district, every day, for as long as the posting stands. Put fuel, driver hours and tyres against that and the annual cost of not replacing a bridge starts to resemble the cost of replacing it.
The trouble is that the two numbers sit in different ledgers. The bridge is a council asset with a council budget line. The detour is paid by a hundred private operators, none of whom send anyone an invoice.
The Queue for Replacement
Why the Stock Aged All at Once
The reason this is arriving now, everywhere, at once, is that it was built then, everywhere, at once. Depression-era relief works put in a wave of bridges through the 1930s. The post-war decades put in a larger one, as county councils metalled and bridged their way into farmland previously served by fords and punts.
Those structures were designed for lives measured in decades – fifty years for much of the timber, closer to a hundred for the better concrete. Sixty to ninety years later, the design lives are expiring in a block rather than a trickle.
Asset managers call it the renewal bow wave. Every council can name the bridges in it. Knowing has never been the constraint.
Renewals Compete Against Renewals
The money is where it gets decided. Council roading programmes are co-funded: the council puts up a share from rates, and the National Land Transport Fund – the pool of fuel excise, road user charges and registration revenue that pays for the land transport system – puts up the rest.
The split is set by each council’s Funding Assistance Rate, a percentage fixed on the basis of rating capacity and network size, and the programme is approved in three-year blocks through the National Land Transport Programme.
Inside that envelope a bridge replacement does not compete against roading in general. It competes against the other renewals: pavement rehabilitation, resurfacing, drainage, the bridge two valleys over. A structure carrying eighty vehicles a day loses to a resurfacing programme carrying eight thousand, on exactly the arithmetic the system was built to run.
What Councils Do Instead of Replacing
So councils manage instead. Strengthening a bridge – new piles alongside the old, a steel liner, a replacement deck on original abutments – buys twenty years for a fraction of the cost of a new structure, and much of the national effort is now this rather than replacement.
Below strengthening sits monitoring: shorter inspection intervals, a lower posting, a prop in the river, a budget line for something everyone agrees needs doing properly one day.
Two things break the pattern. The first is visible cost, and the queues at the old one-lane Kopu Bridge on the Thames approach were tangible enough, for long enough, to carry a case a modest traffic count never could.
The second is a flood. Emergency works are funded differently and quickly, which produces the uncomfortable observation that the fastest route to a new bridge here has often been losing the old one.
The one-lane bridge is not a charming survival. It is a decision to defer, renewed annually, by people who can show you the file and the numbers behind it. Next time you give way at one, the interesting question is not how old it is. It is who is carrying the cost of it still being there – and it is almost never the organisation that owns it.
4 Comments
Fair summary of the two inspection types, though in practice the general inspection slips to every two years on plenty of low volume rural networks – not because anyone decided to, just resourcing. And the point about scour being invisible at low flow is the one I wish more elected members understood. We can stand on a deck that looks perfect and know there is a problem four metres down, and that conversation never goes well.
The bit about harvest contractors is exactly it. We have a 12 tonne posting on the bridge at the bottom of our road and the forager has to come the long way round every single season. Been on the district plan renewal list since before my father retired.
Angus, without knowing your district – that list is real, and so is the Funding Assistance Rate maths in the article. Ours sits just over half, so every replacement means finding the council share out of rates in the same year, and there is only ever one year’s worth. It is not that nobody wants to fix it.
Good article but you have undersold the freight side. It is not just the detour kilometres, it is the routing certainty. We plan 50MAX work around structures that can take it, and when a bridge drops off the permitted list mid-contract we are the ones eating it, with no sign and no notice. Thirty or forty extra kilometres a load is the visible part.